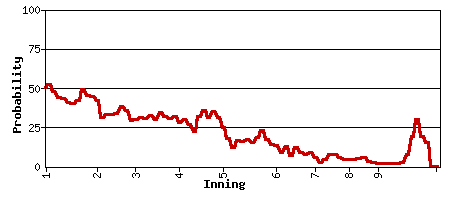
Nothing is worse than false precision — a sign on an outfield fence that says both "400 feet" and "121.92 meters", for instance. That distance from home plate was not measured to a fraction of an inch! It may even be off by several feet. Likewise, something's fishy when a chart purports to show the win probability of a team during a game but contains abrupt wiggles and arbitrary fine structure. For example:
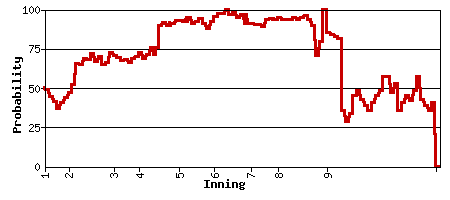
Or even wackier:
What's being graphed is, in fact, the result of looking up how ballclubs did during the past decade or so in seemingly-similar situations. Home teams that are ahead 3-2 in the bottom of the sixth inning, say, with two outs and no one on base, maybe have won 1367 times and lost 496 times. So the chart shows a 73% chance of success.
That's clever but bad, for multiple reasons. It ignores a host of important factors, both micro (who's pitching? who's coming up to bat? who's injured? ...) and macro (what are the average strengths of the teams in today's game? what features of the ballpark affect overall offense and defense? ...). Worse, the table-lookup approach relies on small-number statistics yet ignores the big fluctuations in those numbers due to sampling error. Toss 100 coins, and you're not likely to get exactly 50 heads and 50 tails; the square-root-of-N rule says that you'll probably be within plus or minus 10 of the expected value. And still worse, the past-experience method of baseball handicapping requires big databases and can't be done spur-of-the-moment on the back of an envelope or the label of a beer bottle.
So how should one estimate a team's chances during a game? I've started working on that (mostly during boring meetings when I'm sitting at the back of the room). Perhaps some preliminary results will emerge in months to come. Among the key parameters to consider are clearly:
- fraction of the game remaining
- current score for each team
- average runs/game produced by each team
Ideally a good win-probability formula should be simple to evaluate, should roughly match the table-lookup method, and should approach the following boundary case values:
- the stronger team will win if the game goes on long enough, regardless of the current score
- the team which is ahead will win if the game is near enough to its end, regardless of relative team strengths
- both teams have roughly equal chances if they are equally strong and the score is tied
What other mathematical features should a baseball odds-making system exhibit? Are there other inputs that should be considered? How should the formula be adjusted to align with past experience? What is the proper trade-off between simplicity and accuracy?
(sample charts from Washington Post coverage of Washington Nationals baseball, reputedly based on http://winexp.walkoffbalk.com/expectancy/search ; cf. ProbabilisticTragedy (12 Mar 2003), DrawingTheLine (11 Jul 2004), SquareRootOfBaseball (13 May 2005), InTheBigInning (31 Jan 2006), ...)
TopicRecreation - TopicScience - 2007-04-21
(correlates: VeryGood, Comments on Unknown Knowns, Normal Distribution, ...)